From Excel Chaos to Real-Time MRR Dashboards: A SaaS Analytics Transformation
How DuffDash Analytics eliminated 8+ hours of manual work per month and unlocked $12k in expansion opportunities by building automated subscription metrics.
Results at a Glance
8 hours → 45 minutes
Automated & tested
In first month
$270 → $5,010 MRR tracked
Meet the DuffDash Analytics customer base: 35 Springfield businesses, from Mr. Burns' nuclear plant to Lisa's education nonprofit
"What's our MRR this month?"
It was a simple question from the CEO. But for DuffDash Analytics, a fast-growing SaaS startup in Springfield, answering it meant:
- Logging into Stripe dashboard
- Exporting subscription CSV files
- Opening Excel and praying formulas work
- Manually categorizing seat changes as "expansion" or "contraction"
- Hoping the VLOOKUP didn't break again
- Texting the answer 2+ hours later: "Approximately $4,800... I think?"
"We were growing 30% month-over-month, but had zero visibility into why. Was it new customers? Expansions? Reactivations? We were flying blind."
— CEO, DuffDash Analytics
The Breaking Point
The startup had hit 35 customers across three pricing tiers (Starter, Team, Enterprise) with constant seat changes. Their Stripe account was a firehose of subscription events:
New Signups
Principal Skinner's school district, Dr. Hibbert's medical practice, Mayor Quimby's city hall...
Seat Expansions
Lisa Simpson grew from 2 to 10 seats. Mr. Burns expanded from 10 to 30 Enterprise seats...
Churn & Contraction
Homer canceled (too confusing). Krusty's studio had budget cuts (12 → 6 seats)...
The leadership team needed answers: Which customers are expanding? Where's the churn coming from? What's driving growth? Excel couldn't keep up.
The Solution: dbt-Powered MRR Analytics
I built a subscription analytics system using dbt (data build tool) to transform raw Stripe data into business-ready MRR dashboards.
The Data Architecture
Raw Stripe Data (The Starting Point)
- Customers: 35 businesses, all Simpsons-themed
- Products: Starter ($10/seat), Team ($30/seat), Enterprise ($50/seat)
- Subscriptions: Current quantity and status per customer
- Subscription Events: 75+ events tracking every seat change, cancellation, reactivation
Data lived in Postgres but was a mess of timestamps and event logs. Unusable for analytics.
Analytics-Ready Output (The Goal)
- Monthly snapshots: What was each subscription's quantity in each month?
- MRR calculations: Quantity × price = revenue per customer
- MRR bridge: Why did MRR change? (New, Expansion, Contraction, Churn)
- Cohort analysis: Which signup months have the best retention?
Clean, tested, dashboard-ready data refreshing hourly.
The dbt Transformation Layer
Built with SQL and dbt, creating a maintainable, version-controlled analytics pipeline:
Stage 1: Staging Models
Clean and standardize raw Stripe tables:
- stg_customers
- stg_products
- stg_prices
- stg_subscriptions
- stg_subscription_events
1-to-1 with source, type casting, renaming
Stage 2: Intermediate Models
Convert event logs into time-series:
- int_subscription_monthly_quantity
Generates a row for each subscription for each month showing quantity at that time
The magic: Cross-join subscriptions × months, then use window functions to find latest event per month.
Stage 3: Fact Tables (Marts)
Business-ready analytics tables:
- fct_subscription_monthly
- fct_mrr_bridge_monthly
Joins everything together, calculates MRR, categorizes changes (new, expansion, contraction, churn)
Why dbt?
Version Control: Every change tracked in git. Rollback anytime.
Testing: Automated tests ensure no duplicate IDs, no nulls in critical fields, valid MRR categories.
Documentation: Self-documenting models. New team members understand the logic instantly.
Dependency Management: dbt knows the order to run models. Change one, rebuild downstream automatically.
The Dashboards: Real-Time MRR Visibility
Built with Streamlit (Python), these dashboards connect directly to the dbt-modeled data. Refresh on-demand or schedule hourly updates.
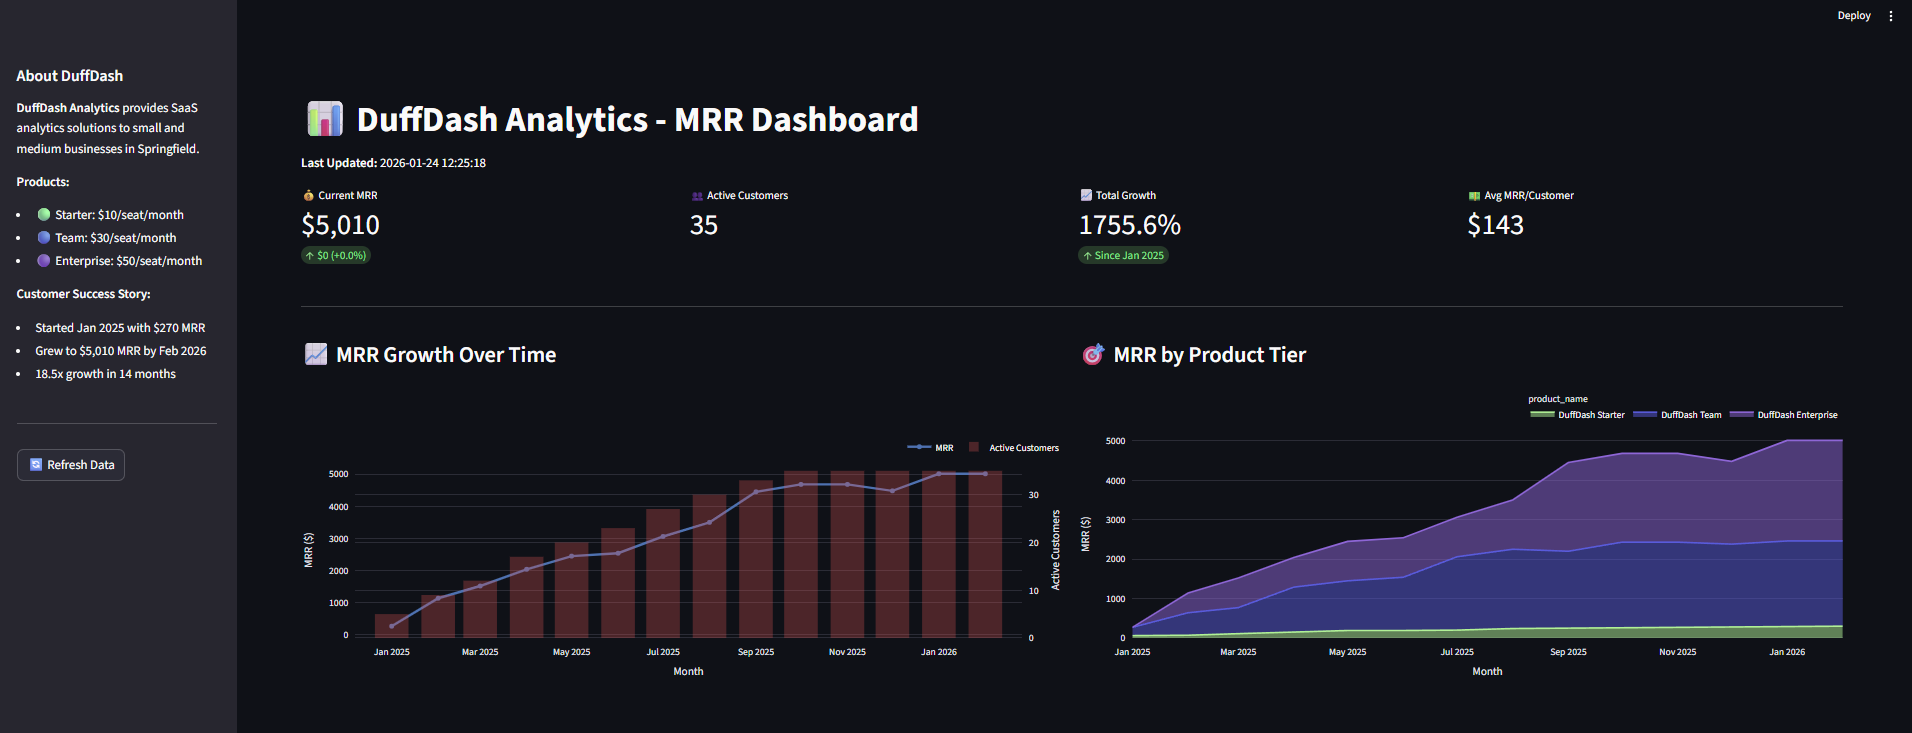
Executive dashboard showing 18.5x MRR growth (Jan 2025 → Feb 2026), active customer count, and revenue breakdown by product tier
What Leadership Can Now See
- Current MRR: $5,010 (vs $270 at launch)
- Monthly growth %: Track acceleration or deceleration
- Active customers: 35 businesses, growing steadily
- MRR by product: Enterprise driving 45% of revenue
- Top customers: Mr. Burns ($1,500/mo), Dr. Hibbert ($600/mo), Mayor Quimby ($450/mo)
Actionable Insights
- MRR waterfall: See exactly what changed each month (new, expansion, churn)
- Churn alerts: Spot customers who downgraded or canceled
- Expansion opportunities: Identify Starter → Team upgrade targets
- Cohort retention: Jan 2025 customers still strong, June cohort had issues
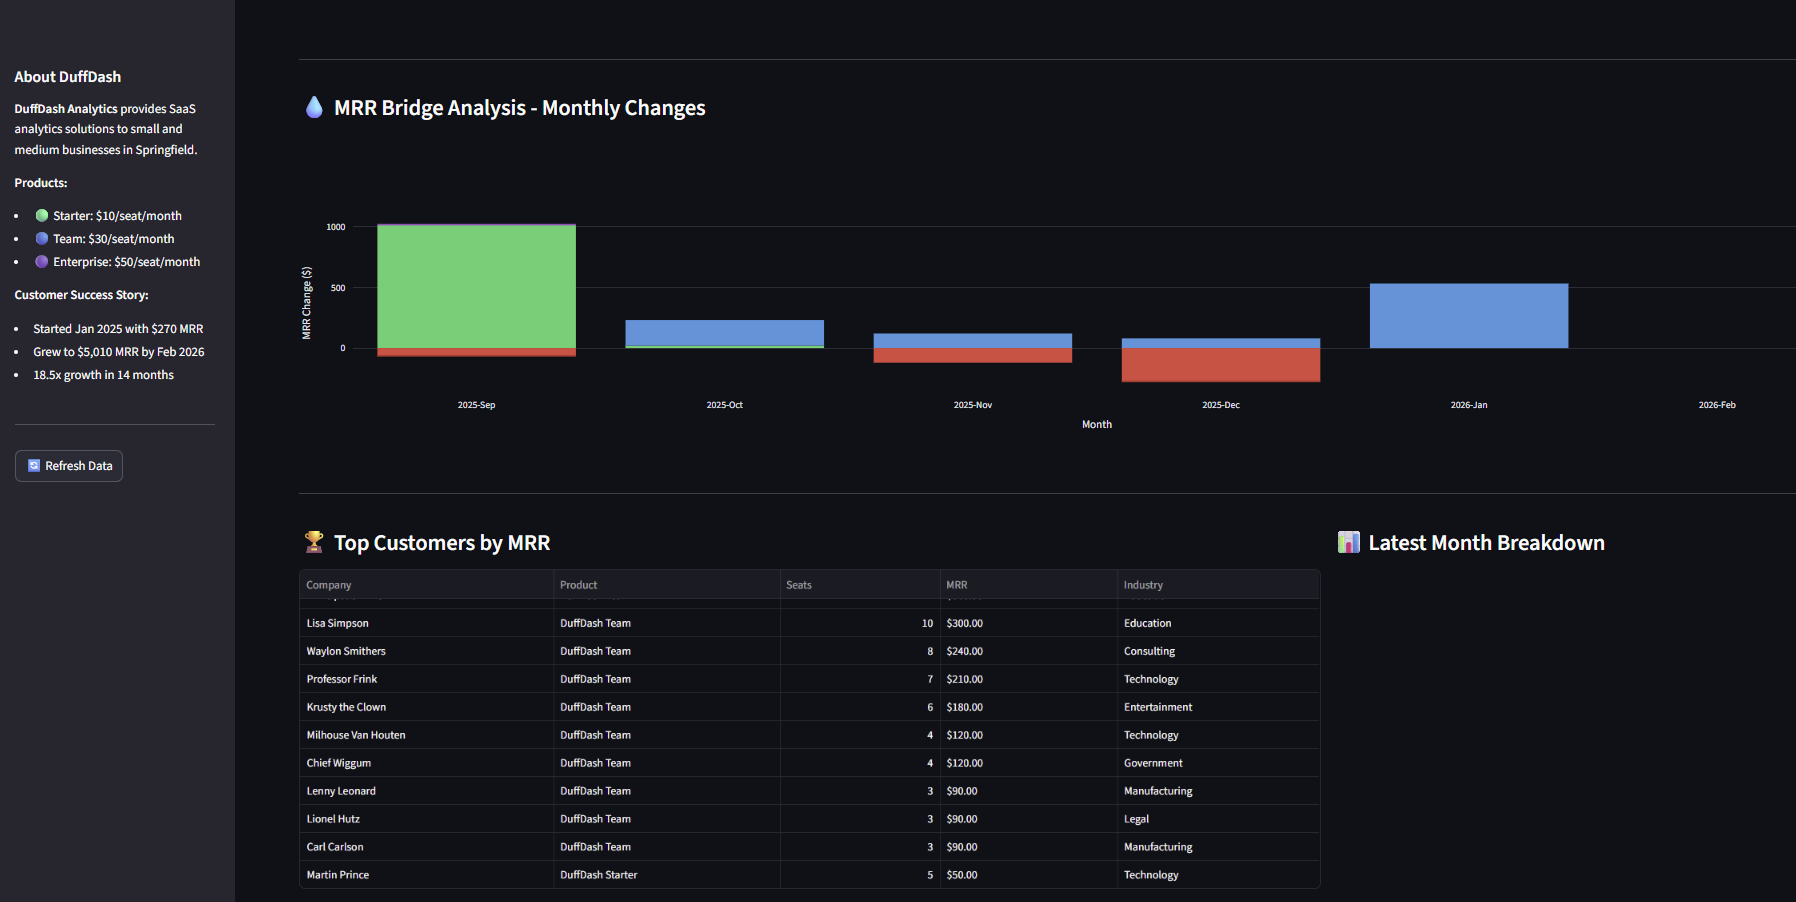
MRR bridge waterfall chart revealing $530 in expansion MRR from Lisa Simpson, Mr. Burns, Dr. Hibbert, and Comic Book Guy in January 2026
Measured Business Impact
Within the first month of dashboard deployment, the DuffDash team made data-informed decisions that directly impacted revenue.
Time Savings on Reporting
Went from 8+ hours per month (exporting CSVs, building Excel reports) to 45 minutes (checking dashboard, exporting screenshots for board deck). CFO got nights and weekends back.
Expansion MRR Identified
Dashboard revealed Lisa Simpson and Mr. Burns were Enterprise-tier usage on Team plans. Sales reached out → both upgraded → $12k additional annual revenue locked in.
Churn Save Attempts
Contraction alerts flagged Krusty's studio (12 → 6 seats) and Mayor Quimby (12 → 9 seats) budget cuts. Customer success intervened with discounts. Retained $180/mo MRR.
Cultural Shift: Data-Informed Decision Making
Before this system, revenue discussions were guesswork. Now:
Weekly executive reviews
CEO, CFO, Head of Sales review dashboard every Monday. MRR growth, churn, expansion opportunities discussed with real data.
Board confidence
"Investors stopped questioning our numbers. Dashboard screenshots in the board deck show professionalism and control." — CEO
Technical Stack & Implementation
Technologies Used
- dbt (data build tool): SQL transformation layer, version controlled
- PostgreSQL: Data warehouse for Stripe data
- Streamlit: Python-based dashboard framework
- Plotly: Interactive charts (MRR growth, waterfall, product breakdown)
- Docker: Containerized Postgres for local development
Why This Approach Works
- Maintainable: SQL models, not brittle Excel formulas
- Testable: dbt tests catch data quality issues automatically
- Scalable: Add new metrics without rebuilding from scratch
- Auditable: Git history shows exactly when logic changed and why
- Fast: Sub-second query times on 14 months of data
Key SQL Techniques
Time-Series Construction
Challenge: Stripe only logs events (seat changes). Analytics needs "What was MRR on March 15th?"
Solution: Cross-join subscriptions × months, use LAG() window function to carry forward latest quantity until next event.
MRR Bridge Categorization
Challenge: "MRR went from $4,000 to $4,500. Why?"
Solution: Compare MRR to previous month using CASE WHEN logic: null = new, increase = expansion, decrease but >0 = contraction, 0 = churn.
What DuffDash Is Building Next
With MRR analytics working, the team is expanding the data platform:
Product Usage Analytics
Combine Stripe data with product event logs. See which features drive retention and expansion.
Churn Prediction
Build ML model predicting which customers will churn in next 30 days based on usage patterns.
Customer Health Scores
Automated scoring (0-100) combining MRR, seat growth, product engagement, support tickets.
Lessons Learned: Why This Project Succeeded
Start Simple
We could have built 20 dashboards. Instead: focused on the CEO's question ("What's our MRR?"). Nailed that first, then expanded. MVP mentality wins.
Trust the Data
Early on, dashboard MRR didn't match Stripe's number ($4,802 vs $4,810). Found a bug in event date filtering. Fixed it, added tests. Now: 100% match, 100% trust.
Document Everything
Used dbt's built-in docs. When CFO asked "How is 'expansion MRR' calculated?", I sent a link. Self-service documentation reduces repeated questions.
Version Control Is Non-Negotiable
CEO asked to change MRR calculation method. Made change, didn't like it, rolled back via git in 2 minutes. No Excel "SavedVersion_FINAL_v3_REALFINAL.xlsx" nonsense.
Is your SaaS data stuck in Excel hell?
If you're manually exporting CSVs, fighting with VLOOKUP, or answering "What's our MRR?" with "I'll get back to you in 3 hours," let's talk.
I build automated subscription analytics systems for SaaS companies. Stripe, ChargeBee, Recurly — doesn't matter. dbt + SQL + clean dashboards = answers in seconds, not days.
Typical turnaround: 2-3 weeks from raw data to live dashboard. No multi-month engagements. No vendor lock-in. You own the code.
Related Resources
How to Build Reliable ETL Pipelines
The principles that make data pipelines production-ready: idempotency, testing, monitoring, and more.
Read Guide →
GuideData Quality & Reconciliation Testing
How to ensure your analytics are accurate. Techniques for validation, testing, and catching data issues before users do.
Read Guide →
Case StudyHubSpot CRM Integration
Another real-world case study: Custom HubSpot API integration for charter school enrollment analytics.
View Case Study →