Charter School Enrollment Analytics: HubSpot API Integration & Power BI Dashboards
How a custom HubSpot data integration revealed hidden enrollment opportunities and improved lead follow-up across multiple charter schools.
Results at a Glance
The Business Challenge
What the Organization Was Using
The charter school organization relied on HubSpot CRM to manage their entire enrollment funnel:
- Prospective student and parent leads
- Application lifecycle stages
- Enrollment decisions and confirmations
- Communication tracking across schools
What Was Missing
Despite having all their data in HubSpot, leadership lacked critical visibility:
- Which leads were untouched or stalled
- Where applicants were dropping off
- Application-to-enrollment conversion rates
- Performance comparisons across schools
Why HubSpot Reporting Wasn't Enough
HubSpot's built-in reporting tools couldn't provide:
Multi-School Aggregation
No easy way to compare performance across 10+ schools in one view
Historical Trend Analysis
Limited ability to analyze year-over-year enrollment patterns
Custom Object Analytics
HubSpot custom objects (applications, enrollments) weren't accessible in standard reports
The HubSpot Data Integration
I built a custom HubSpot API integration that extracted, transformed, and loaded CRM data into an analytics-ready format.
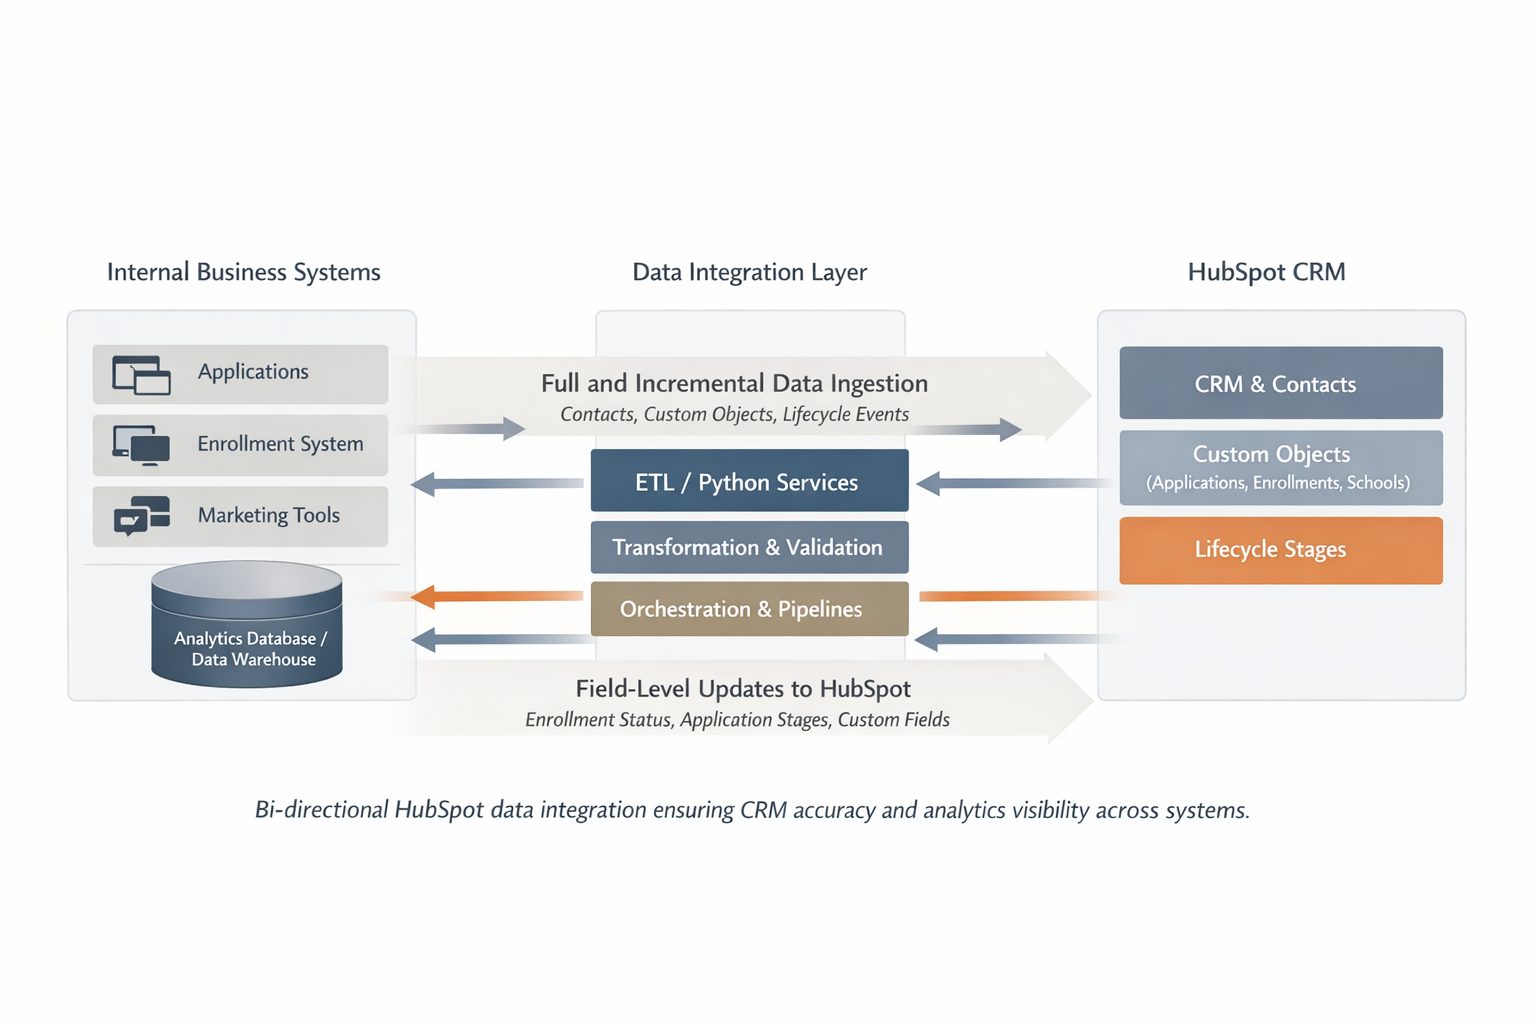
Bi-directional HubSpot data integration ensuring CRM accuracy and analytics visibility across systems
What Data Was Extracted
Core HubSpot Objects
- Contacts: Students, parents, guardians
- Associations: Links between contacts and schools
- Lifecycle Stages: Lead, MQL, SQL, Application, Enrolled
- Engagement Data: Emails, calls, meetings
Custom HubSpot Objects
- Applications: Start date, completion status, school
- Enrollments: Decision status, enrollment date
- School Attributes: Location, capacity, program type
- Status Transitions: Timestamped lifecycle changes
Technical Approach
Incremental Data Ingestion
The integration ran daily to capture:
- New and updated contacts
- Lifecycle stage changes
- Custom object modifications
- Deleted or archived records
No manual CSV exports required — fully programmatic via HubSpot API.
Data Validation & Quality
Built-in checks ensured reliability:
- Schema drift detection
- Record count reconciliation
- Missing field alerts
- Association integrity checks
Data issues were flagged before reaching dashboards.
Analytics Enablement: Power BI Dashboards
With clean, analytics-ready data, the organization built Power BI dashboards that revealed what was actually happening in their enrollment funnel.
Enrollment Funnel Visibility
Track the complete journey from lead to enrolled student:
- Total leads by school — see which campuses need support
- Contacted vs untouched leads — identify gaps in follow-up
- Applications started vs completed — spot drop-off points
- Enrollments confirmed vs dropped — understand yield rates
Marketing Performance Insights
Understand what's driving enrollment success:
- Lead sources by channel — ROI by marketing campaign
- Conversion rates by source — which campaigns convert best
- Time-to-contact metrics — are leads being followed up quickly?
- School-level comparisons — benchmark across locations
The Critical Difference: Custom Object Reporting
These dashboards consumed HubSpot custom objects (applications, enrollments, school associations) — something that's not achievable with HubSpot's built-in reporting alone.
By modeling this data in a warehouse, leadership could finally ask and answer questions like:
- "Which school has the highest application-to-enrollment conversion rate?"
- "How many applications started but never completed?"
- "What's our average time from inquiry to enrollment decision?"
- "Which lead sources produce the most enrolled students?"
Measured Business Impact
Within the first academic cycle after dashboard rollout, the organization saw data-informed improvements across key metrics.
Reduction in Untouched Leads
Previously hidden leads were identified and reassigned to admissions counselors. What was invisible became actionable.
Faster Time-to-First-Contact
Average response time dropped from ~4.5 days to ~3.7 days. Leads received follow-up while still engaged.
Increase in Application Completion
Driven by better follow-up prioritization. More started applications actually got finished.
Estimated Enrollment Impact
Based on historical enrollment conversion rates and improved funnel metrics:
Estimated increase in enrolled students attributed to better lead visibility and follow-up
Additional enrollments for a school enrolling ~400 students annually
"Improved operational efficiency and visibility translated into measurable enrollment gains."
What Leadership Gained
From Reactive to Proactive
Before the dashboards, leadership discovered problems after enrollment cycles ended.
Now, they have:
- Real-time enrollment funnel snapshots
- Weekly performance comparisons across schools
- Early warnings for underperforming campaigns
- Data-driven decisions during enrollment season
Visibility Without Overhead
The integration runs automatically with minimal maintenance:
- Daily incremental updates
- Automated data quality checks
- Self-service dashboards for leadership
- No manual exports or spreadsheets
Teams can focus on enrollment, not data wrangling.
What Was Delivered
HubSpot API Integration
Python-based ETL pipeline extracting contacts, custom objects, associations, and lifecycle events
Analytics Data Warehouse
Cleaned, modeled data optimized for enrollment funnel analysis and reporting
Data Quality Framework
Automated validation checks, reconciliation reports, and schema drift detection
Dashboard Foundation
Power BI data models enabling enrollment funnel, lead performance, and school comparison dashboards
Documentation & Handoff
Architecture diagrams, data dictionary, troubleshooting guide, and maintenance runbook
Training & Enablement
Dashboard training for leadership and data stewardship guidelines for admissions team
Key Takeaways
A well-built HubSpot integration doesn't just move data — it reveals lost opportunities, improves follow-up, and gives teams the clarity they need to act.
- HubSpot's built-in reporting has limits, especially for custom objects and multi-entity aggregation
- API-based data extraction enables analytics that aren't possible in HubSpot alone
- Incremental loading and validation are critical for trustworthy dashboards
- Business impact comes from visibility — teams can't act on what they can't see
My Role
I focused on data engineering, integration, and analytics enablement. Dashboard design and business usage were enabled by the data foundation I built.
I did not claim ownership over marketing strategy or admissions policy — my job was to make the invisible visible, so teams could finally see and act on what was happening in their enrollment funnel.
Need Help with HubSpot Data Integration?
Whether you're using HubSpot for sales, marketing, or operations — if you need better visibility into your CRM data, let's talk.